Oct 17, 2022


2015 was a pivotal year for ESG: the climate Paris agreement was signed and the UN Sustainable Development Goals were launched. Since then the interest in ESG has surged and many questions arose surrounding how to best assess companies from the perspective of ESG. While opinions vary as to what ESG can and can not do, making long-term investment decisions requires understanding of sustainability risks.
In this blog we look at how you can integrate ESG factors into your equity analysis using Xignite’s Global ESG API powered by ESG Book’s sustainability data.
ESG Book combines cutting edge technology and proprietary research to fix a fundamental problem: markets need clearer ESG information to allocate finance efficiently to more sustainable outcomes.
ESG Book brings together corporate reporting, news, and NGO campaigns, and with AI transforms them into ESG investment insights. ESG Book data is delivered in real-time through Xignite’s Global ESG API for efficient and up-to-date sustainability analysis.
To understand the potential for long-term performance, the ESG Book methodology considers the principle of financial materiality. That is, the algorithm used to compute the ESG Scores of a company will only use information that significantly helps explain future risk-adjusted-performance.
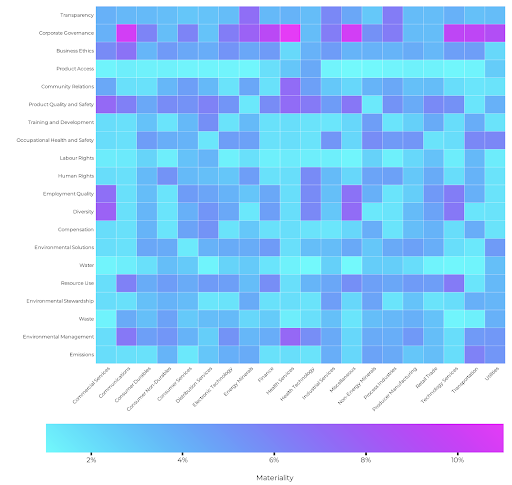
The materiality matrix below details the mean sector materiality weight of each of the categories that underlie the ESG score. The weight is given by the color intensity on the color bar under the chart.
Sector materiality differs, with particular categories being more heavily weighted in the Environmental and Social dimensions. For example, Product Access is particularly impactful across the Finance, Health Services and Health Technology sectors. We can see that across sectors, the governance sustainability topics are particularly material, such as Business Ethics and Corporate Governance.
Sector Materiality

The concept of Financial Materiality underpins the ESG score and makes it well suited for identifying companies that are positioned to outperform in the long run. An ESG score is based on three underlying pillars: Environment, Social, Governance.
The Global Compact (GC) score is composed of the Human Rights, Labor Rights, Environment, and Anti Corruption pillars. It is best used for approximation of reputational risk. Although the two scores are correlated, companies may have significantly different values for their GC and ESG scores. When companies perform well on financially immaterial topics, they will increase their GC score to a larger extent than their ESG score. Similarly, performing poorly on immaterial topics will negatively affect their ESG score less than it will negatively affect their GC score.
Let’s take a detailed look at The Coca-Cola Co. and how it measures up against its peers. The Peer Group below represents the top 10 companies by market-cap within The Coca-Cola Co.’s business sector. Market capitalization, business sector and industry can be accessed via XigniteFactSetFundamentals.
The overall ESG and GC scores give us a relative position of the company. The scores are 0-100 where higher is better. We can see that The Coca-Cola Co. is lagging significantly behind its peers.

Now that we know the overall relative position of the company, we can take a closer look at the individual category scores to help us understand the company’s relative strengths and weaknesses.


Note that not only you can see where the company stands today, but you can measure the trend over time. The data is updated daily and 5 years of history is available. For The Coca Cola Co. we can notice that the Environment pillar has a negative trend of -9.1%.

Understanding sustainability risks surrounding a company is an important part of any investment process. With Xingite’s platform you can seamlessly combine ESG insights and company fundamentals into a comprehensive business evaluation. The real time nature of Xignite’s Global ESG API allows you to stay atop of any changes in the outlook and the availability of historical data allows you to measure trends over time.
By focusing on the sustainability issues that are material to a company's financial performance, you can identify companies that are positioned to outperform in the long run.
Additional company specific assessments are available upon request.


Free Stock Market APIs
7 Day Free Trial


